Fixing CloudFront miss can be a time-consuming task. But, if you are receiving “Miss from Cloudfront” this is usually because of the headers sent from the origin.
CloudFront caches content based upon the header sent from the origin. To resolve this we first need to identify the headers being sent. This is an easy process by opening Chrome developer tools and viewing the network tab to retrieve the list of headers:
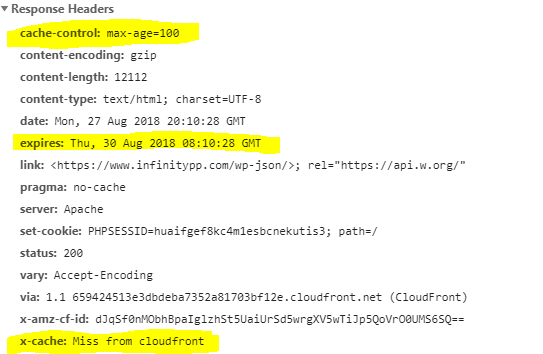
In the screenshot above, the page is sending two important headers:
| cache-control | this tells CloudFront how long this page should be cached in seconds. In our example it’s 100 seconds. |
| expires | This tells CloudFront when should the page be expired. |
CloudFront considers pragma as a valid header and respects it! To resolve and let CloudFront cache the page we need to either remove the “pragma” header or set it to “public“.